Hi,
How to add Dataset to Scatter Chart ?
I saw in the Extension code that I have to add as object containing X and Y properties … but how ?
/// <summary>
/// Scatter charts are based on basic line charts with the x axis changed to a linear axis.
/// To use a scatter chart, data must be passed as objects containing X and Y properties.
/// </summary>
Scatter
Regards
Hi Marcelo,
in that case you´re probably better off using ChartJs directly inside a Wisej.Web.Widget.
You´d need to handle it with Javascript callbacks.
See Chartjs documentation and configure it like you would do in a plain html page.
https://www.chartjs.org/docs/latest/configuration/legend.html#legend-label-configuration
Best regards
Frank
Great Frank
Is there an way to put a legend to each point ?
Regards
Hi Marcelo,
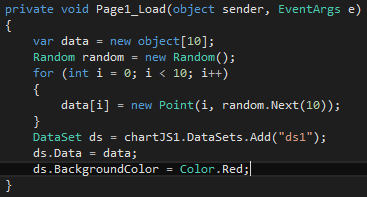
you can achieve it with code like this:

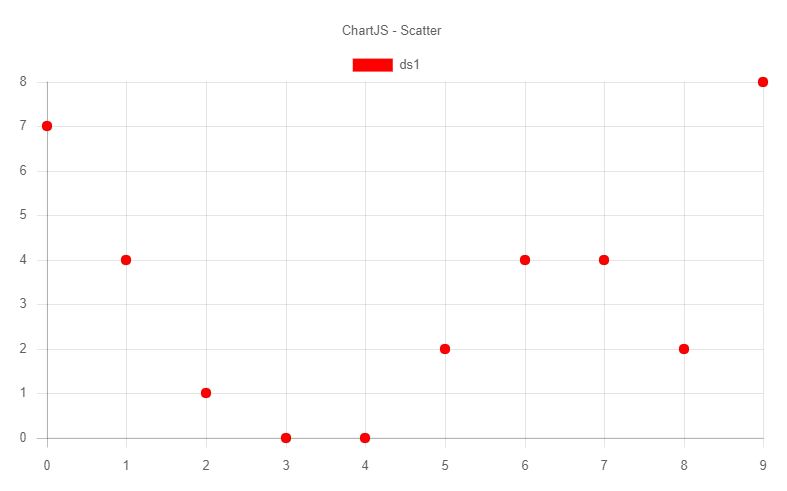
Sample chart:

Hope that helps.
Best regards
Frank
Please login first to submit.
