Hi all,
For the life of me I can’t get chartjs to work and can’t find any useful docs. on it, either.
I need:
1/ A date/time x-axis with a user-adjustable timespan (default 10 minutes)
2/ User adjustable y-axis but with option to autoscale to any or all data series
3/ Chart will be line type and should behave like a strip-chart, continuously scrolling as new data is added
4/ Programmatically add/remove and hide/show series on the fly.
Is there a limit on the number of series?
5/ User zoom functions, if possible?
6/ User scroll functions, if possible?
7/ Option to smooth lines, if possible (as opposed to straight lines between points)
8/ Set a gradient background on the chart, if possible?
Any guidance on the above greatly appreciated!
Thanks
Darren
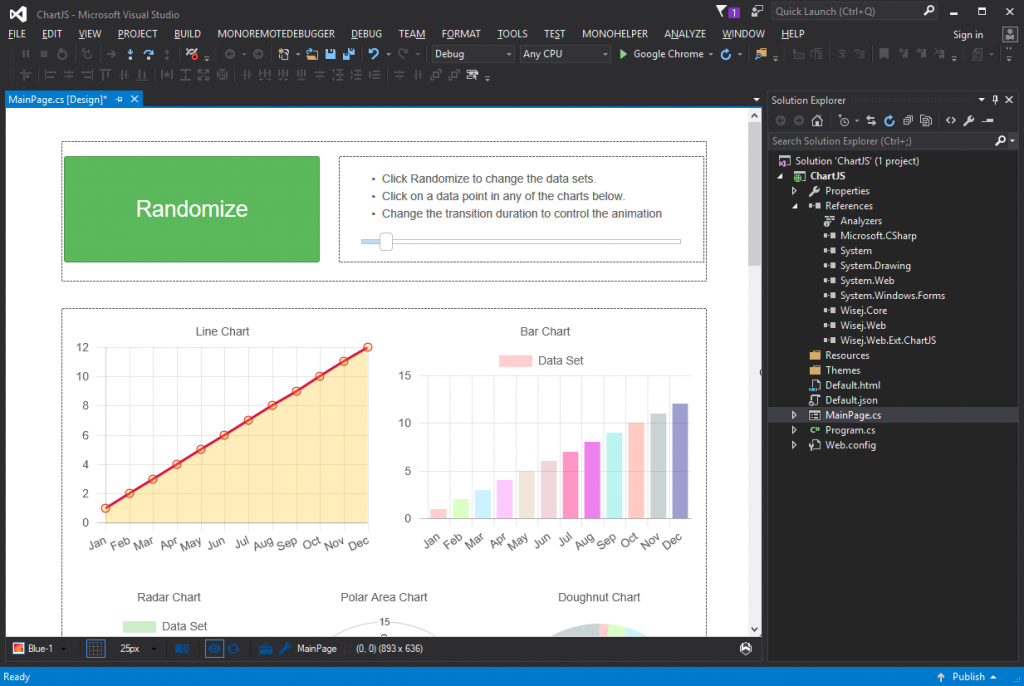
I just downloaded ChartJs sample from https://wisej.com/examples. Unzipped the project. Opened the sln in Visual Studio 2015. Recompiled. Double clicked on MainPage.cs (it’s a web application, which is a class library) to open it in the designer, this is what I get:
The I simply clicked Run (Google Chrome button at the top), and I get this:
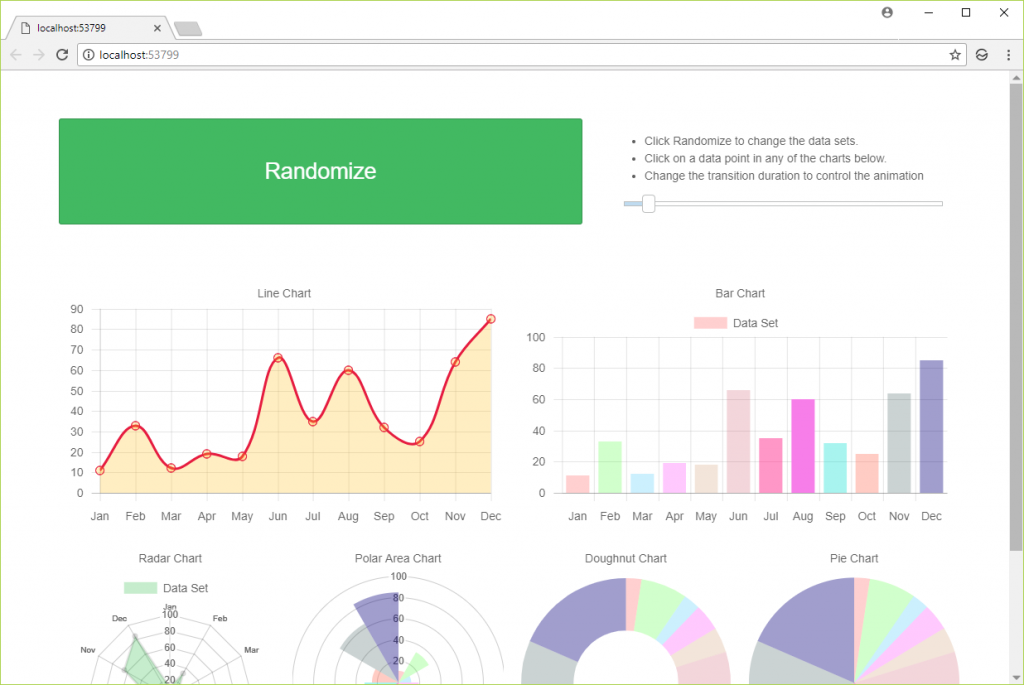
I didn’t change anything in the project. All the samples are in C# but they work just the same in VB.NET.
There is a (hopefully) working sample in /examples.
I don’t know all the functionality of chart js, it’s here: https://www.chartjs.org/
Please login first to submit.