I have tried it with the following code. I do not get an error, but nothing shows in the column.
Me.dgvServer.DataSource = mServerList
Me.dgvServer.Columns(“column0”).Width = 400
Dim rowCounter As Integer = 0
For Each row In Me.dgvServer.Rows
Dim oServer As bo.CPUinfo = TryCast(row.DataBoundItem, bo.CPUinfo)
Dim chart As New Wisej.Web.Ext.ChartJS.ChartJS
Dim data = From x In oServer.Stats Select x.CPUtotal
Dim LineDataSet1 As Wisej.Web.Ext.ChartJS.LineDataSet = New Wisej.Web.Ext.ChartJS.LineDataSet()
LineDataSet1.BackgroundColor = System.Drawing.Color.FromArgb(CType(CType(139, Byte), Integer), CType(CType(191, Byte), Integer), CType(CType(63, Byte), Integer))
LineDataSet1.BorderColor = System.Drawing.Color.FromArgb(CType(CType(139, Byte), Integer), CType(CType(191, Byte), Integer), CType(CType(63, Byte), Integer))
LineDataSet1.Data = data.ToList().ToArray()
LineDataSet1.Label = “Internal”
LineDataSet1.PointRadius = 1
chart.DataSets.Add(LineDataSet1)
chart.UpdateData()
chart.Text = “Chart”
chart.Options.Scales.yAxes(0).ScaleLabel.LabelString = “Test Data”
chart.Labels = New String() {2, 4, 6, 25, 22}
Me.dgvServer.Rows(rowCounter)(“column0”).Control = chart
chart.Size = New System.Drawing.Size(799, 428)
rowCounter = rowCounter + 1
Next
The problem is that when using databinding the rows and cells are recreated when the binding context changes. It can change several times: when the control is created, the the parent changes, etc. The best way to manipulate data bound rows is to handle DataBindingComplete or to assign the datasource after the datagrid is created.
In your sample, you can switch LoadData() after Show() and it works
Dim window As New Window1()
window.Show()
window.LoadData()
It makes no difference visually since nothing shows on the client until the request is terminated.
Or you can attach to DataBindingComplete instead.
It doesn’t look like my file attached, so I am trying to add that sample.
Thank you for your example. However I am still not able to get it to work. I have included a sample project of what I am doing.
If I take the code to make the chart and add it to a panel.controls.add(chart) it works, so I think I am close.
Can you take one more look at my issue?
Thanks,
Shawn R
Yes, but you need to initialize the chartjs both axes. See below:
var cjs = new Wisej.Web.Ext.ChartJS.ChartJS()
{
Dock = DockStyle.Fill
};
this.dataGridView1[0, 0].Control = cjs;
cjs.Options.Legend.Display = false;
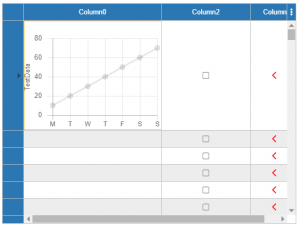
cjs.DataSets.Add("TestData").Data = new[] { 10, 20, 30, 40, 50, 60, 70 };
cjs.Labels = new[] { "M", "T", "W", "T", "F", "S", "S" };
cjs.Options.Scales.yAxes[0].ScaleLabel.LabelString = "TestData";
 // Edited: cjs.Options.Scales.xAxes = new Wisej.Web.Ext.ChartJS.OptionScalesAxesX[] {};
 // This works too:
 cjs.Options.Scales.xAxes[0].Type = Web.Ext.ChartJS.ScaleType.Category;
You may also use System.Web.UI.DataVisualization.Charting and user painted cells to create sparklines, see the “User Paint Cells” here: /examples. In this case you are not using a control, but creating the chart in memory, drawing the cell, and discard it.
Please login first to submit.