Hi Shawn,
thanks, I fixed the reference. Please download the extension again.
I have also create a sample to show how to use the extension:
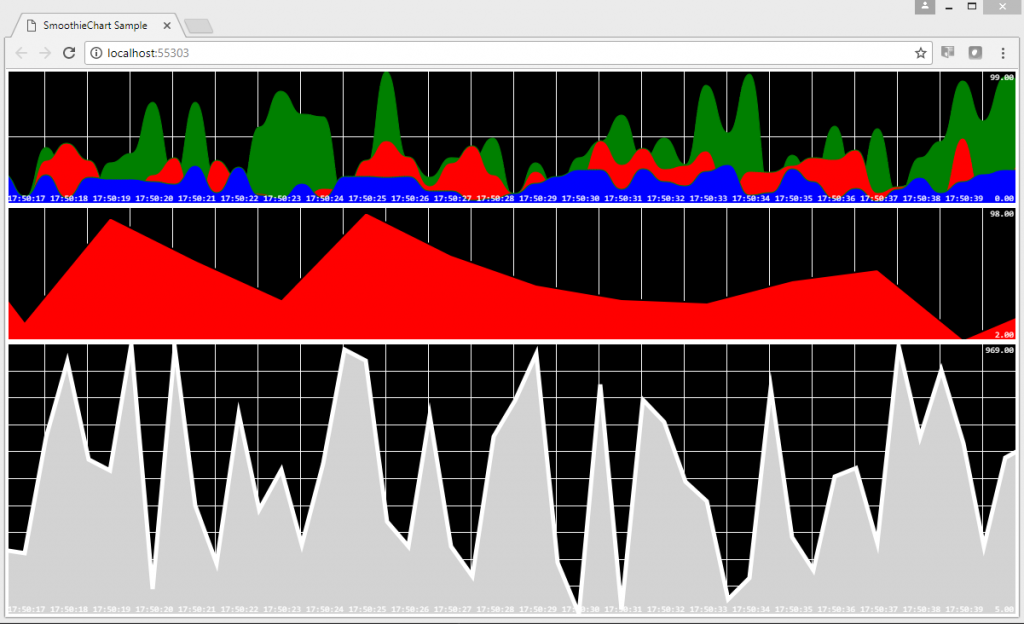
It shows 3 instances of the SmoothieChart in a TableLayoutPanel control. The first has 3 TimeSeries while the other 2 only have one.
The range for 1 and 3 is 0 to 100 and for the 2nd it is 0 to 1000. All three have different colors and different styles.
You can set those properties either through the designer or from code. Here is a sample for the TimeSeries:
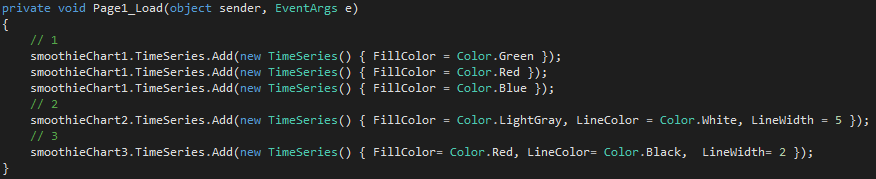
The actual data is provided through the DataNeeded event. And here you can see the Beauty of Wisej feeding a client side component with server side data easily and transparently:
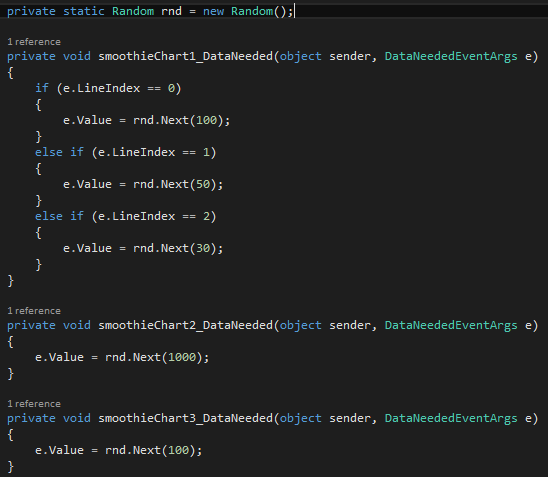
The first instance distinguishes between its 3 different TimeSeries, while the other two just provide random data within their range.
You can try it online: http://demo.wisej.com/SmoothieChartSample
or download the source: http://wisej.s3.amazonaws.com/support/attachments/SmoothieChart.zip
Best regards
Frank
Hi Edmond,
the port used by Websocket is the same as the first http request:
http://myapp.com is port 80
http://myapp.com:8080 will use port 8080 also for Websocket
Hope that helps.
Best regards
Frank
We updated the phone to the newest iOS and the issue resolved itself. If anyone has info on why it wouldn’t work before, but the WiseJ geolocation test page did, we’d love to know more…Thanks
Hi Andrew,
let me add a few lessons learned:
Hope this helps
Best wishes
Thomas
Hi Vishal,
can you please tell the version of Wisej that you are using ? If it´s not the latest, can you please retry with that one ?
Thanks in advance !
Best regards
Frank
Hi Shawn,
this works fine for us, when we tried it. Can you please create a sample that shows that problem ?
Please note that you do not need to set the location explicitly since the controls are in a flow panel.
Thanks in advance !
Best regards
Frank
Hi Mariano,
thanks, it will be fixed in the next Wisej build.
We´ll notify you when it´s available.
Best regards
Frank
Hi Marian,
we have tried to reproduce here, but could not.
Any chance to provide us with a test case ?
Thanks in advance !
Best regards
Frank
Hello,
thank you for your answer and the information.
But I have an additional question.
Is it possible to use LocalReport?
Because I have no ReportServer, I cannot use the descriped code.
Do you have/know a sample which is using LocalReport instead of ReportServer.
Thank you
Greetings
Rupert
The problem is that when using databinding the rows and cells are recreated when the binding context changes. It can change several times: when the control is created, the the parent changes, etc. The best way to manipulate data bound rows is to handle DataBindingComplete or to assign the datasource after the datagrid is created.
In your sample, you can switch LoadData() after Show() and it works
Dim window As New Window1()
window.Show()
window.LoadData()
It makes no difference visually since nothing shows on the client until the request is terminated.
Or you can attach to DataBindingComplete instead.
You don’t have to cache each item. You can place anything in the cache. I’d put it an object that contains a list of files and a callback method.
It doesn’t look like my file attached, so I am trying to add that sample.
Thank you for your example. However I am still not able to get it to work. I have included a sample project of what I am doing.
If I take the code to make the chart and add it to a panel.controls.add(chart) it works, so I think I am close.
Can you take one more look at my issue?
Thanks,
Shawn R
Hello, testing 1.4.35, when combobox with readonly property is set from true to false displayed text is changed to blank, in bindingsource scenary.
Thanks.
Thats the problem. I don’t want each item to fire an expiration. I want to refresh the entire list from the cache and reload because there will be new items to load and other items will no longer be in the file.
You can use HttpRuntime.Cache or System.Web.Caching.Cache which are basically the same thing. Look also under System.Runtime.Caching. You can use any of those. When adding an entry in the cache you can specify the absolute expiration or sliding expiration and a callback invoked when the item is removed by the cache.
You can also start any thread from your wisej app and handle things from there. Once the thread is started it goes by itself and has no relation to the wisej app.
Remember that an app pool recycle will clear the cache and stop all threads.
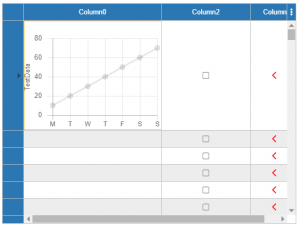
Yes, but you need to initialize the chartjs both axes. See below:
var cjs = new Wisej.Web.Ext.ChartJS.ChartJS()
 {
 Dock = DockStyle.Fill
 };
 this.dataGridView1[0, 0].Control = cjs;

cjs.Options.Legend.Display = false;
 cjs.DataSets.Add("TestData").Data = new[] { 10, 20, 30, 40, 50, 60, 70 };
 cjs.Labels = new[] { "M", "T", "W", "T", "F", "S", "S" };
 cjs.Options.Scales.yAxes[0].ScaleLabel.LabelString = "TestData";
 // Edited: cjs.Options.Scales.xAxes = new Wisej.Web.Ext.ChartJS.OptionScalesAxesX[] {};
 // This works too:
 cjs.Options.Scales.xAxes[0].Type = Web.Ext.ChartJS.ScaleType.Category;
You may also use System.Web.UI.DataVisualization.Charting and user painted cells to create sparklines, see the “User Paint Cells” here: /examples. In this case you are not using a control, but creating the chart in memory, drawing the cell, and discard it.
We usually build a PDF on the server and deliver it to the client for reports.
Using iTextSharp.
Hi Luca,
thanks for clarification about the SessionTimeout.
But is there any possiblity from the client side (Java script) e.g. in case of the network error to call the Login form again with some parameter (text: You’re logged out due to network error) or set a label of this form to a certain text ?