In our growing list of extensions for Wisej we recently added a cool JavaScript charting widget for streaming data in a scrolling chart. It´s called SmoothieChart. Learn more about it at http://smoothiecharts.org/
The Wisej extension we created lets us use it very easily and demonstrates how to feed a pure Javascript widget with server based data in a smooth and transparent way.
Here is a sample that shows 3 instances of the SmoothieChart in a TableLayoutPanel control:
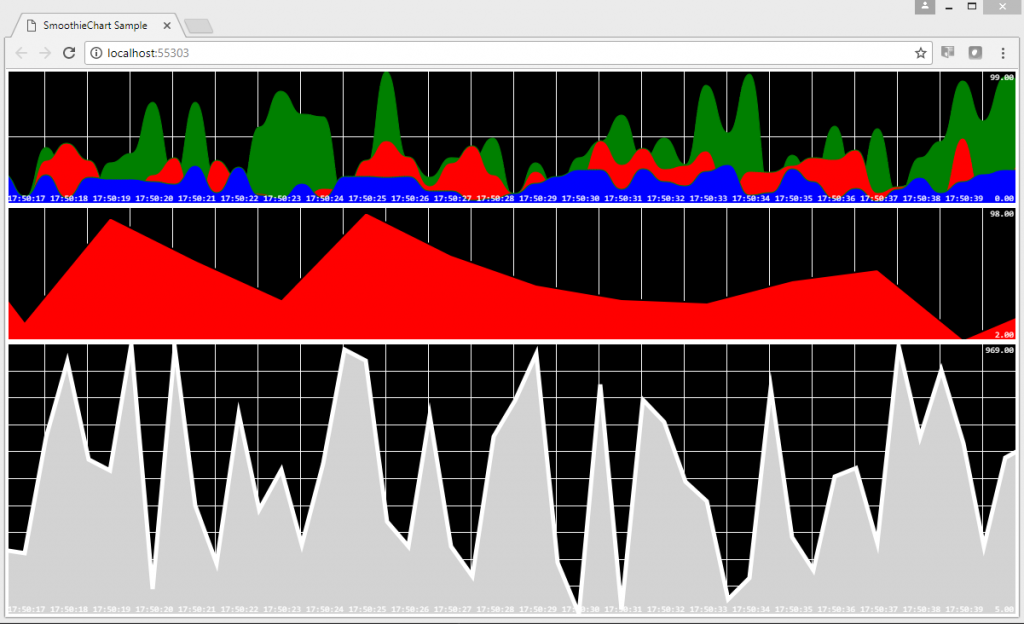
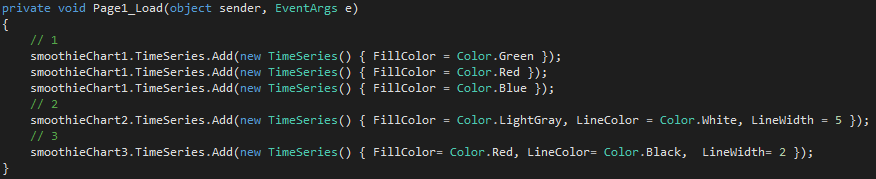
The first instance has 3 TimeSeries and the other 2 only use one.
While the range of 1 and 3 is from 0 to 100, the 2nd instance uses a range from 0 to 1000.
All three instances are set up with different colors and styles.
All those properties are set either in the Visual Studio designer or from code.
Find here a sample of the TimeSeries definition (in PageLoad):
The actual data is provided through a server event called DataNeeded. In our sample we simply supply the widget with random numbers of various ranges. This can easily be replaced, of course, with real data gathered from databases, devices, web services etc.
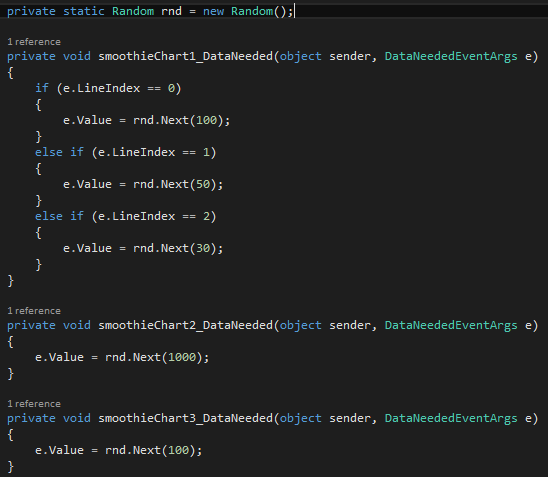
The first instance uses the event args to distinguish between its 3 different TimeSeries while the other two just provide random data within their widget range.
Using the TableLayoutPanel and the 3 widgets docked to it, the app is responsive. You can verify this by resizing the browser and see the different widgets resize accordingly while keeping their ratio.
Find many more cool and useful extensions at https://www.wisej.com/extensions